代码
# install.packages('planr')
library(tidyverse)
library(reactable)
library(reactablefmtr)
library(plotly)
library(highcharter)
library(planr)
planr是一个用于进行R语言库存分析的R包,它可以帮助用户更好地理解和管理库存数据。
# install.packages('planr')
library(tidyverse)
library(reactable)
library(reactablefmtr)
library(plotly)
library(highcharter)
library(planr)blueprint是planr包中的一个数据集,它包含了一些商品的库存数据。这里我们使用一个单件商品的例子,即Item 000001,选取DFU、Period、Demand、Opening、Supply这5个变量
df_plan_item_000001 <- blueprint |>
  filter(DFU == "Item 000001") |>
  select(DFU, Period, Demand, Opening, Supply)
df_plan_item_000001 |> head()
# A tibble: 6 × 5
DFU Period Demand Opening Supply
<chr> <date> <dbl> <dbl> <dbl>
1 Item 000001 2022-07-03 364 6570 0
2 Item 000001 2022-07-10 364 0 0
3 Item 000001 2022-07-17 364 0 0
4 Item 000001 2022-07-24 260 0 0
5 Item 000001 2022-07-31 736 0 0
6 Item 000001 2022-08-07 859 0 0light_proj_inv是planr包中的一个函数,用于预估期末库存水平(Projected.Inventories.Qty)及周期覆盖范围(Calculated.Coverage.in.Periods)
df_inv_proj <- light_proj_inv(dataset = df_plan_item_000001, DFU = DFU, Period = Period, Demand = Demand, Opening = Opening, Supply = Supply)
df_inv_proj |> head()
DFU Period Demand Opening Calculated.Coverage.in.Periods
1 Item 000001 2022-07-03 364 6570 16.8
2 Item 000001 2022-07-10 364 0 15.8
3 Item 000001 2022-07-17 364 0 14.8
4 Item 000001 2022-07-24 260 0 13.8
5 Item 000001 2022-07-31 736 0 12.8
6 Item 000001 2022-08-07 859 0 11.8
Projected.Inventories.Qty Supply
1 6206 0
2 5842 0
3 5478 0
4 5218 0
5 4482 0
6 3623 0使用reactable包展示预估库存水平及覆盖范围
df_inv_proj <- df_inv_proj |>
  select(
    Period,
    Demand,
    Calculated.Coverage.in.Periods,
    Projected.Inventories.Qty,
    Supply
  ) |>
  mutate(f_colorpal = case_when(
    Calculated.Coverage.in.Periods > 6 ~ "#32CD32",
    Calculated.Coverage.in.Periods > 2 ~ "#FFFF99",
    Calculated.Coverage.in.Periods > 0 ~ "#FFA500",
    TRUE ~ "#FF0000"
  ))
df_inv_proj |>
  reactable(
    resizable = TRUE, showPageSizeOptions = TRUE,
    striped = TRUE, highlight = TRUE, compact = TRUE,
    defaultPageSize = 20,
    columns = list(
      Demand = colDef(
        name = "需求",
        cell = data_bars(df_inv_proj,
          fill_color = "#3fc1c9",
          text_position = "outside-end"
        )
      ),
      Calculated.Coverage.in.Periods = colDef(
        name = "覆盖期数",
        maxWidth = 90,
        cell = color_tiles(df_inv_proj, color_ref = "f_colorpal")
      ),
      f_colorpal = colDef(show = FALSE),
      `Projected.Inventories.Qty` = colDef(
        name = "预计库存",
        format = colFormat(separators = TRUE, digits = 0),
        style = function(value) {
          if (value > 0) {
            color <- "#008000"
          } else if (value < 0) {
            color <- "#e00000"
          } else {
            color <- "#777"
          }
          list(
            color = color
            # fontWeight = "bold"
          )
        }
      ),
      Supply = colDef(
        name = "供应",
        cell = data_bars(df_inv_proj,
          fill_color = "#3CB371",
          text_position = "outside-end"
        )
      )
    ),
    columnGroups = list(
      colGroup(name = "预估", columns = c(
        "Calculated.Coverage.in.Periods",
        "Projected.Inventories.Qty"
      ))
    )
  )
使用柱形图展示库存及短缺情况
df_inv_proj |>
  transmute(
    Period, Projected.Inventories.Qty,
    IsStocked = case_when(Projected.Inventories.Qty > 0 ~ "库存", TRUE ~ "短缺")
  ) |>
  ggplot(aes(x = Period, y = Projected.Inventories.Qty, fill = IsStocked)) +
  geom_bar(stat = "identity") +
  labs(x = "时间", y = "库存/短缺", fill = "库存/短缺", title = "库存/短缺情况") +
  theme_minimal() +
  scale_fill_manual(values = c("库存" = "#008000", "短缺" = "#e00000")) +
  scale_y_continuous(labels = scales::comma) +
  scale_x_date(date_labels = "%Y-%m")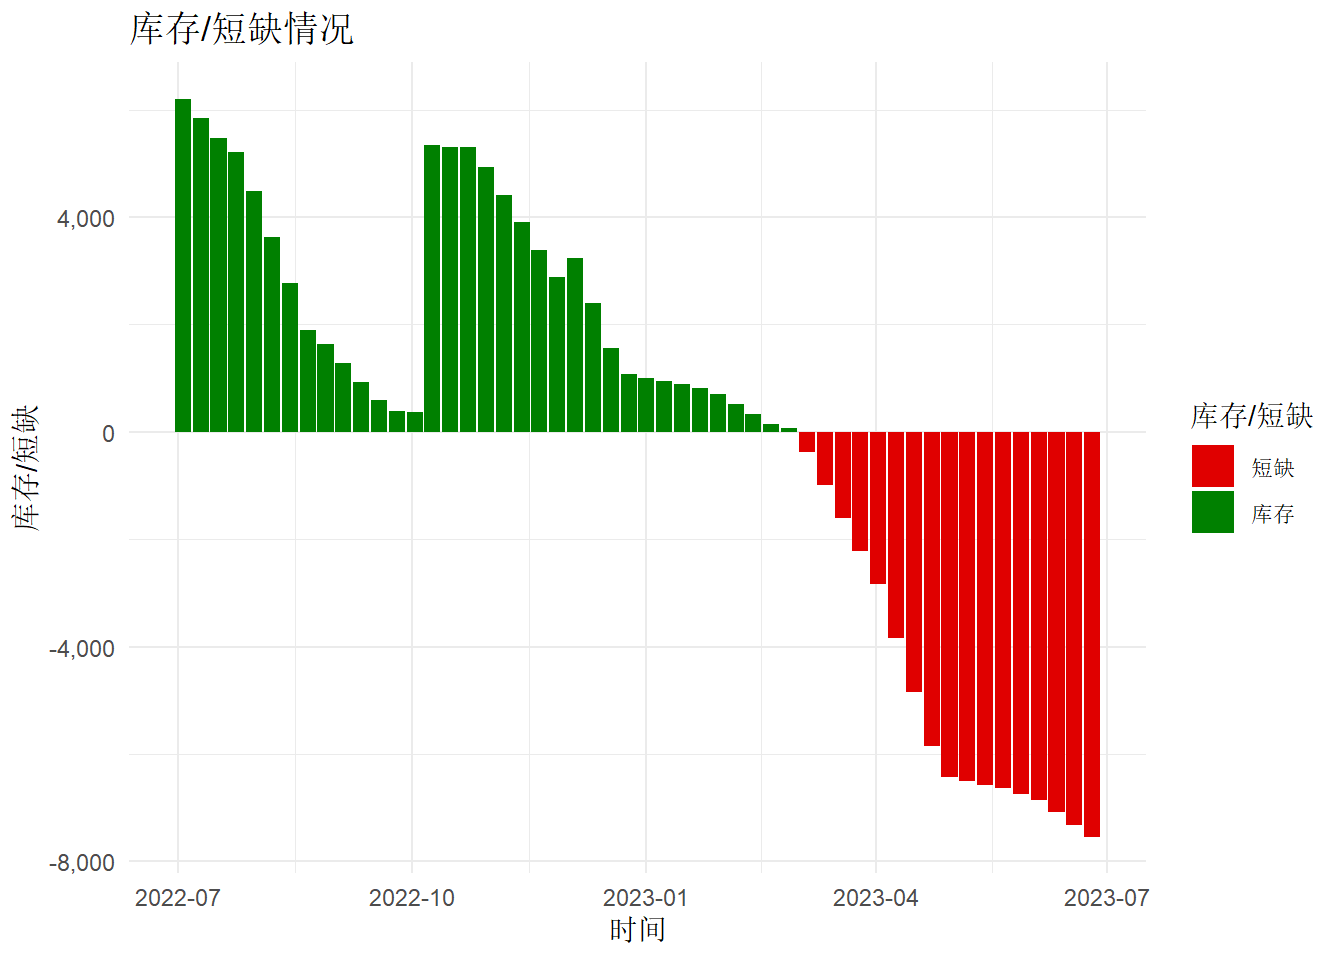
针对多个DFU进行分析,我们可以构建一个表格来分析一段时间内的库存情况
df_mutil_dfu <- blueprint |>
  filter(Period <= "2022-09-25") |>
  light_proj_inv(DFU = DFU, Period = Period, Demand = Demand, Opening = Opening, Supply = Supply) |>
  group_by(DFU) |>
  summarise(
    DemandList = list(Demand),
    SupplyList = list(Supply),
    Demand = sum(Demand),
    Supply = sum(Supply),
    Opening = sum(Opening),
    IsDelay = if_else(min(Projected.Inventories.Qty) <= 0, "Delay", "OK"),
    PIQuantity = list(Projected.Inventories.Qty)
  ) |>
  ungroup() |>
mutate(DemandPercent = Demand / sum(Demand))library(sparkline)
library(htmltools)
status_badge <- function(color = "#aaa", width = "9px", height = width) {
span(style = list(
display = "inline-block",
marginRight = "8px",
width = width,
height = height,
backgroundColor = color,
borderRadius = "50%"
))
}
df_mutil_dfu |>
reactable(
compact = TRUE,
defaultSortOrder = "desc",
defaultSorted = c("Demand"),
defaultPageSize = 20,
columns = list(
`DFU` = colDef(name = "DFU"),
`Demand` = colDef(
name = "总需求",
aggregate = "sum", footer = function(values) formatC(sum(values), format = "f", big.mark = ",", digits = 0),
format = colFormat(separators = TRUE, digits = 0),
style = list(background = "yellow", fontWeight = "bold")
),
`DemandPercent` = colDef(
name = "需求占比",
format = colFormat(percent = TRUE, digits = 1)
), # close %
`Supply` = colDef(
name = "总供应",
aggregate = "sum", footer = function(values) formatC(sum(values), format = "f", big.mark = ",", digits = 0),
format = colFormat(separators = TRUE, digits = 0)
),
`Opening` = colDef(
name = "期初库存",
aggregate = "sum", footer = function(values) formatC(sum(values), format = "f", big.mark = ",", digits = 0),
format = colFormat(separators = TRUE, digits = 0)
),
DemandList = colDef(
name = "预估需求",
cell = function(values) {
sparkline(values)
}
), SupplyList = colDef(
name = "预估供应",
cell = function(values) {
sparkline(values,
type = "bar"
)
}
),
PIQuantity = colDef(
name = "预计库存",
cell = function(values) {
sparkline(values,
type = "bar"
)
}
),
IsDelay = colDef(
name = "短缺风险",
cell = function(value) {
color <- switch(value,
OK = "hsl(120,61%,50%)",
Delay = "hsl(39,100%,50%)"
)
badge <- status_badge(color = color)
tagList(badge, value)
}
)
),
defaultColDef = colDef(footerStyle = list(fontWeight = "bold")),
columnGroups = list(
colGroup(
name = "需求",
columns = c(
"Demand",
"DemandPercent",
"DemandList"
)
),
colGroup(
name = "供应",
columns = c("Supply", "SupplyList")
),
colGroup(
name = "库存",
columns = c("Opening", "PIQuantity", "IsDelay")
)
)
)该表格可以清晰的展示哪些产品可能会出现负库存风险